Quarterly Market Reports can show us all where the market has gone and the direction we might be heading. We are in the final quarter of 2023, and this post compares how each quarter has performed and which neighborhood experienced its strongest quarters.
Back Bay Condo
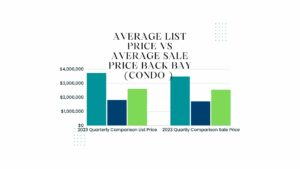
Back Bay: So, if you look at the 1st Quarter Back Bay, the strongest Quarter has been the first Quarter 1st, where the average list price was $3,738,419, and the average sale price was $3,488,054. However, homes in the Back Bay during the first quarter lingered on the market for 78 days. Yet, in the second and third quarters, the market days decreased.
In the 1st Quarter Back Bay, the housing market changed. On average, homes were listed for $1,816,033 and sold for $1,716,480. It took 70 days for homes to sell, eight days less than the previous quarter. However, prices went down compared to the first quarter.
In the third quarter, the housing market improved. On average, homes were listed for $2,603,980 and sold for $2,545,086. It took 59 days for homes to sell.
Which size home performed the best in the Condo Market
I scrutinized the numbers and questioned why we observed lower second-quarter figures than other quarters. There could be a couple of reasons at play.
1) In the second quarter, the Federal Reserve increased rates by 0.25%, which might lead to higher costs for both buyers and sellers.
2) In the first quarter, 15 expensive sales ranged from 3 million to 23 million. However, in the second quarter, there were only eight transactions of this kind. Sales prices rose in the third quarter, reflecting the peak of the spring market. Examining the size of homes in Back Bay, one-bedroom condos were the exception, consistently increasing in price each quarter. However, studios, two-bedrooms, and three-bedrooms all encountered a dip in both list and sale prices in the second quarter.
Back Bay Single Family Market
You might be asking yourself how the single-family market performed each Quarter. There was not enough data to break down quarter-to-quarter. The third Quarter has been the only One that had activity and sold at asking for $5,000,000.
Beacon Hill Condo
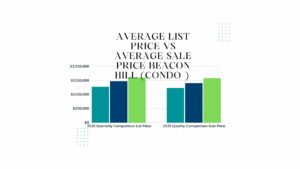 Beacon Hill Condo: Beacon Hill, once Boston’s priciest, is beside Back Bay, historically known for being the most expensive area in Boston. However, now the Seaport district has taken that title. Curious about parallels, I examined Back Bay’s condo market across quarters. Interestingly, Beacon Hill saw a gradual price increase. During the first quarter, homes were listed for 108 days, reaching their lowest prices for listing and selling.
In the first quarter, the average list price was $1,273,258, and the average sale price was $1,236,281. In the second quarter, houses were listed at an average of $1,473,711. They sold for $1,404,657 and were on the market for 40 days. In the second quarter, homes were listed at an average of $1,473,711. They sold for $1,404,657 and were on the market for 40 days. In the third quarter, it took more time for houses to sell, about 52 days on average. The homes were listed at an average price of $1,605,814 and sold for an average of $1,580,231.
Looking at the size of homes, most had their lowest prices in the first quarter. However, three-bedroom homes started the year with higher prices. The second quarter saw an adjustment, followed by a rebound in the third quarter.
Beacon Hill Single Familly Market
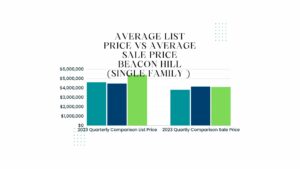 Beacon Hill’s Single-family market made some adjustments. The best Quarter was in the third Quarter. Both first and second-quarter list prices were much different than what a home in Beacon Hill sold for. In the first quarter, homes were listed at an average price of $4,618,750. They sold for an average of $3,812,500, which took 101 days. In the second quarter, homes were listed at an average price of $4,481,250. They sold for an average of $4,162,500, which took 78 days.
In the third quarter, homes were listed at an average price of $5,403,333 and sold for an average of $4,111,667. They sold pretty fast, taking only 53 days. Sellers wanted more money than buyers were willing to pay, showing a clear gap in price expectations between them.
Charlestown Condo Market
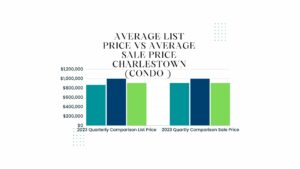 Charlestown Condo Market Throughout each quarter until the third quarter, the seller’s asking price underwent adjustments from the sale price. In the first quarter, houses were listed for $867,031, sold for $856,776, and took 60 days to sell. After that, in each following quarter, the time it took to sell homes decreased. In the second quarter, it took 29 days for homes to sell. They were listed at an average price of $1,000,100 and sold for $999,920. In the third quarter, maybe because of higher interest rates and increased costs, the listed price dropped to $906,844. The homes were sold for $906,815, and it took to sell them was 25 days. Notably, the average list price and average sale price had a minimal difference of $29. The Charlestown housing market, historically strong, raises questions about staying strong or showing weakness in the last quarter.
Charlestown Single Family Market
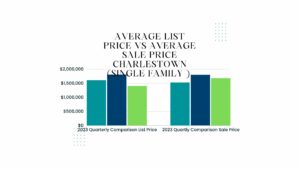 Charlestown Single Family: In Q2, sellers almost reached their price goal but adjusted in Q1 and Q3 to successfully close deals. Not a lot, but they had to lower the asking price for the buyer to agree. In all three quarters, homes in Charlestown sell in about 30 days, showing that many people want to live there. Sellers are setting reasonable home prices, avoiding outright rejection by the public. As 2023 ends, a key question arises: Will the single-family home market finish strong or show signs of weakening? Additionally, will home prices follow a downward or upward trend because of limited supply?
Savin Hill Condo Market
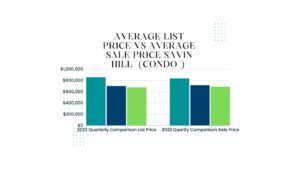 Savin Hill Condo Market’s first Quarter was the weakest. The houses were listed for about $858,900 and typically sold for $836,843, taking 66 days to find a buyer. In the following quarters, we noticed a decrease in the days the homes were on the market. In the second quarter, the average list price was $701,536, and the average sale price was $715,786. And days went to 21 days on the market and the third Quarter. The homes were listed at $679,700, sold for an average of $688,542, and it took 33 days to sell them. What will the final Quarter of 2023 be? In the last quarter, will the average list price and sales price increase, or are prices getting softer despite low inventory?
Savin Hill Single Family Market
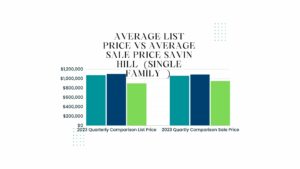 Savin Hill Single Family: Entering the busy Q2 housing market, homes sold faster, though not as much as in Q3. In Q1, houses performed well.
In the spring-busy Q2, homes stayed on the market for an average of 21 days. The houses were listed at an average price of $1,100,000 and sold for an average of $1,087,500. This aligns with the seasonality of increased buyer activity and new listings. In the third quarter, sellers listed their homes at $899,000, selling above the asking price of $950,000. Homes in the third quarter sold rapidly, with an average of only three days on the market. Will Savin Hill end the year like Q3, or will it have longer days on the market?
Jamaica Plain Condo Market
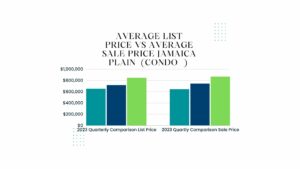 Jamaica Plain. In Jamaica Plain, the third quarter emerged as the strongest despite homes staying on the market longer. Home sales in the condo market performed well, with notable improvements in list and sale prices. In Q1, homes sold in 52 days, with an average list price of $655,381 and an average sale price of $645,922.During the busy spring of Q2, the average list price rose to $719,977, and homes sold for $745,674 in 28 days. In the third quarter, strength continued with an average list price of $848,650 and an average sale price of $868,000. Will Jamaica Plain condos maintain their trend, or will federal interest rate hikes cause a drop in home prices? Expecting slight declines in asking prices, close alignment between list and sale prices is predicted due to limited inventory.
Jamaica Plain Single Family Market
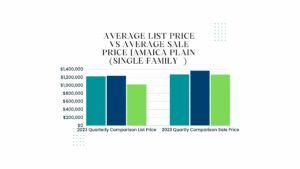 Jamaica Plain Single Family Market While the single-family market has exhibited strength, its performance may seem nuanced. Homes in Q1 had an average list price of $1,224,187, spent 40 days on the market, and sold for $1,269,238. Moving to the second quarter, the average list price slightly increased to $1,239,677. In the peak of the spring market, the average sale price jumped to $1,366,309, with a shorter 30-day market stay. Despite a lower average list price of $1,023,608 in Q3 compared to Q2, the sale price reached $1,265,551, with 38 days on the market. Notably, more buyers accepted the seller’s asking price or negotiated minimally on homes in the market. Thus, while the single-family market may not be considered weak, it displays variations in performance.
Midtown Condo Market
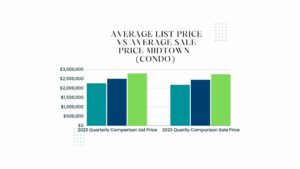 Midtown: At the start of the year, like many markets, Midtown had the longest days. In Q1, homes were on the market for 126 days, with an average list price of $2,262,618 and a sale price of $2,176,818. In Q2, amid the busy spring market, the average list price was $2,493,950, with 42 days on the market. The average sale price was $2,450,273, with a slim $43,677 difference between list and sale prices, showing effective negotiation. You might be thinking, well, maybe homes stay on the market longer. Homes have the shortest days on the market, 42 days on the market. Examining the third quarter, often considered a softer period, condos remained on the market for over 58 days. Limited inventory and higher interest rates had minimal impact on the Midtown market due to the scarcity of available properties. The question lingers: will this trend persist into the next quarter? Answers will unfold soon.
North End Condo Market
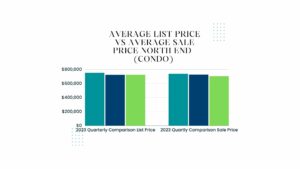 North End: The Average List price for the first quarter was $750,168, and the average sale price was $738,804. In Q2, homes spent 39 days on the market, with an average list price of $722,492 and an average sale price of $725,958. Continuing to demonstrate strong demand, the third-quarter prices illustrate a resilient market. The average list price registers at $723,128, while the average sale price experiences a slight decline, settling at $703,648. Nonetheless, prices are holding up reasonably well, and the days on the market remain steady at 28 days. The bedroom market in the second Quarter saw the most significant boost.
Seaport Condo Market
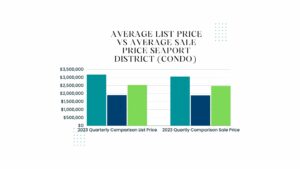 Seaport: Like most cities, the Second Quarter was weaker than the first. What differs from Seaport District is that the longest days on the market have been the third Quarter. In Q3, while homes linger longest, it’s crucial to note that asking and sale prices are closest. Considering buying a Seaport condo with different bedrooms, costs consistently rose in the three-bedroom market each quarter.
South Boston Condo Market
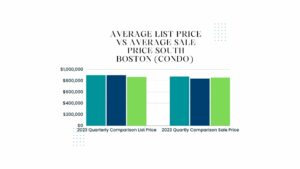 South Boston Condo- In South Boston, the condo market experienced its lengthiest period in the first quarter at 62 days. Subsequently, homes spent fewer days on the market in each ensuing quarter. Notably, South Boston never encountered a quarter with a significant price leap from the list to the asking price.
In Q1, homes had an average list price of $899,229, sold for $875,073, and were on the market for 62 days. In Q2, the average list price was $899,229, and the average sale price was $836,494. Surprisingly, the public did not accept the same listing price in Q1 and Q2. The days on the market have slid down to 40 days. In Q3, the average list price was $866,347, homes sold for $854,195, and the days on the market were 27. Usually, in Q3, days on the market rise, but that didn’t happen in the South Boston condo market. During the third quarter, three-bedroom homes uniquely witnessed a consistent increase in average sales prices. Conversely, studios, one-bedroom, and two-bedroom units experienced more of a roller coaster ride than a steady climb or decline.
South Boston Single Family Market
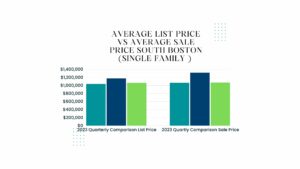 South Boston Single Family Market: the days on the market where single-family homes sat on the market was the second quarter. In Q2, homes stayed on the market for 70 days, just two days less than the 68 days in Q1. Moving to the third quarter, homes saw a further reduction in market time, with a duration of 63 days. The Average List price for the first quarter was $1,066,414, and the average sale price was 1,158,045. Homes first quarter seller got more property at asking or above asking. Second quarter $1,174,268
was the average list price, and the average sale price was 1,158,045. Third quarter, the average sale price was $1,065,465, and the average sale price was $1,071,294.00. While South Boston single-family home sales saw modest gains, sellers had to make overall adjustments to facilitate sales. However, these adjustments were not substantial.
South End Condo Market
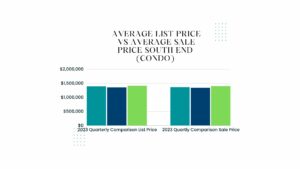 South End Condo Market Every month of the year, homes still sold above asking. In Q1, homes began with an average list price of $1,393,556, sold for $1,364,342, and were on the market for 47 days. In Q2, homes were on the market for 42 days, with an average list price of $1,356,434 and a sale price of $1,343,699. Typically, we expect a bump in pricing, but that didn’t happen. Third-quarter homes were listed for $1,413,265, and the average sale price was 1,400,510.
Homes stayed on the market for 39 days. The gains quarter to quarter were not huge. This could indicate that rising rates could have impacted those would-be buyers. Two and three bedrooms performed best if you compare performance quarter to quarter. There were constant gains in average price. In Q4, will the sale price keep falling, or will the average list price stay high with a sale price adjustment?
South End Single Family
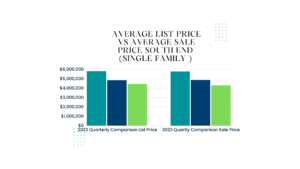 South End Single Family In Q2, the housing market performed best, with homes on the market for just 27 days and sellers receiving close-to-asking or above-asking offers. The average sale price beat the list price. The third quarter showed signs the market was reacting to the Fed’s raising rates and other economic factors.
Fenway Condo Market
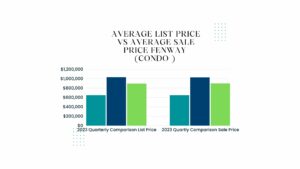 Fenway Condo – Fenway had its worst sales in Q1, but every other quarter saw relatively strong performance in condo sales. In Q2, homes typically stay on the market longer than in Q1 and Q3. One bedroom saw the most significant average sales growth. Both studios, two and three bedrooms, saw an increase but went up and down. Which area makes sense? The site is attractive for the Berkley School of Music, Conservatory, Northeastern, and Emerson. In Q2, homes usually take longer to sell than Q1 and Q3. It makes sense why one bedroom saw continued growth. Additionally, there’s a trend of people preferring to live with fewer neighbors, making one-bedroom units more desirable.
Waterfront Condo Market
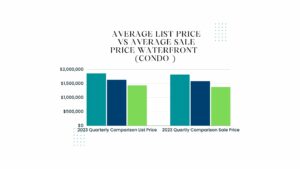 The Waterfront – The Waterfront Condo Market had its best quarter in the first quarter. The home stayed on the market longer than in later quarters, but sellers likely got closer to their asking price. In the second and third quarters, condo prices were close to asking, though a noticeable difference suggested a shift. Q3, with the longest market time, led sellers to concede up to $60,000 between the average list and sale prices. In Q2, sellers conceded up to $50,000 between the list price and the average sale price, a smaller difference. The first quarter seller left on the table only 39,000 between the list price and sale price. One-bedroom units were the best-performing condos per quarter, typically appreciated. Two and three-bedroom prices fluctuated both up and down.
Brighton Condo Market
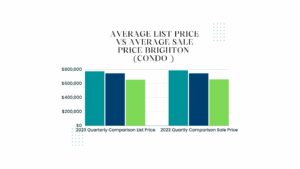 Brighton-Brighton’s best quarter was the first, whether you sought a studio, one-bedroom, two-bedroom, or even a three-bedroom. However, condo prices followed a descending trend after the first quarter, with the average sale price decreasing each quarter. Despite this, the overall average sale price increased each quarter. In Q1 and Q3, sellers likely got their asking price or even exceeded it, given the higher average sale prices. The first quarter recorded the highest days on the market, but subsequent quarters displayed a downward trend in market duration.
Brighton Single Family
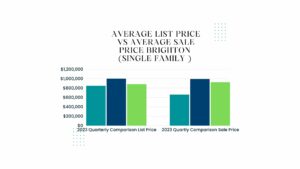 Brighton Single Family- The Brighton single-family market experienced its peak in the second quarter, displaying fluctuations in the first and third quarters. In Q1, homes took 42 days to sell, with an average list price of $850,000 and a sale price of $662,500. In Q2, the average list price rose to $1,002,411, and the days on the market decreased compared to Q1. The average sale price also rose to $995,111, with homes spending 25 days on the market. In the third quarter, the list price was $886,167, and the average sale price was $927,467. Unlike the usual Boston trend, where Q1 is most robust, this wasn’t the case for the Brighton family market. In the third quarter, most homes spent the shortest time on the market, at 16 days.
Brookline Condo Market
 Brookline Condo Market – In Q1, homes took 59 days to sell, with an average list price of $1,065,656 and a sale price of $1,036,814. Notably, first-quarter studio sales performed well. However, heading into the second quarter, Brookline Studios experienced a downturn. In Q2, Brookline condos averaged a $1,221,999 list price and $1,220,329 sale price, with 39 days on the market. Although second-quarter studio prices dropped, one-bedroom, two-bedroom, and studio average prices significantly improved.
In Q3, homes were listed at $1,176,659, stayed on the market for 35 days (a bit longer), and sold for $1,170,580.In the third quarter, two bedrooms slide down at the average sale price of $947,270. Three bedrooms improved on average sale price if you looked at where we started. In the first quarter, it could be observed in the third quarter and declined when examining the second quarter. The average list price is $1,360,553.
Brookline Single Family
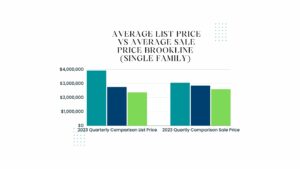
Brookline Single Famly: Brookline, every single quarter, except the first quarter, always got at asking or over asking. The first quarter was the only one with homes sitting on the market longer, while the second quarter remained consistent.. Second-quarter family homes remain on the market for 24 days, and the Third quarter remains for 23 days.
Cambridge Condo Market
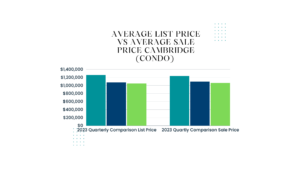 Cambridge Condo: Cambridge Condo performed the best in the Second and third quarters. The second quarter condo stays on the market the shortest at 31 days. First-quarter homes remain on the market the longest at 55 days. In the third quarter, the days on market uptick listing from 31 to 34 days on the market. The average sale price and condo size decreased from the prior quarter to the second and third quarters.
Cambridge Single Family Market
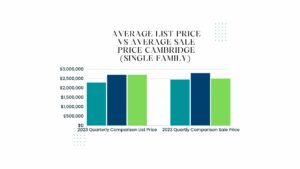 Cambridge Single Family: Every quarter in the Cambridge single-family market experienced gains except for the third quarter. A significant price gap surfaced between sellers’ asking prices and buyer acceptances in the third quarter. The third quarter was also where homes stayed on the market for the shortest time. In Q1, homes stayed for 68 days, in Q2 for 46 days, and in Q3 for the fastest at 34 days.
Conclusion
We are in the final month of 2023 and going into an election year. Many folks believe election years impact Real Estate, and typically, the data shows election years do not hurt or help the real estate market. It all depends on how consumers feel about the economy. Real Estate in some parts of the country did see a downturn in 2023, but in the Northeast, home prices didn’t go down due to a lack of inventory. They just went up. Realtor.com has come out with its 2024 predictions, and the relief buyers or renters are looking for is unlikely to present itself. Due to pent-up demand, sellers will likely see bidding wars return, and home prices will probably stay elevated till more inventory comes online. If you are a buyer or seller and making plans for 2024, I am happy to jump on Zoom or meet you at a local coffee shop or my office to discuss your plans for 2024. Contact me anytime



Leave a Reply